TSP SAMPLER CALIBRATION CALCULATION SPREADSHEET
| Location : Tsung Yuen Ha Village House No. 63 Location ID : AM1 | Date of Calibration: 26/8/2013 Next Calibration Date: 26/10/2013 Technician: Ben Tam | ||||||
|---|---|---|---|---|---|---|---|
| CONDITIONS Sea Level Pressure (hPa) 1006.8 Temperature (oC) 28.8 | Corrected Pressure (mm Hg) 755.1 Temperature (K) 302 | ||||||
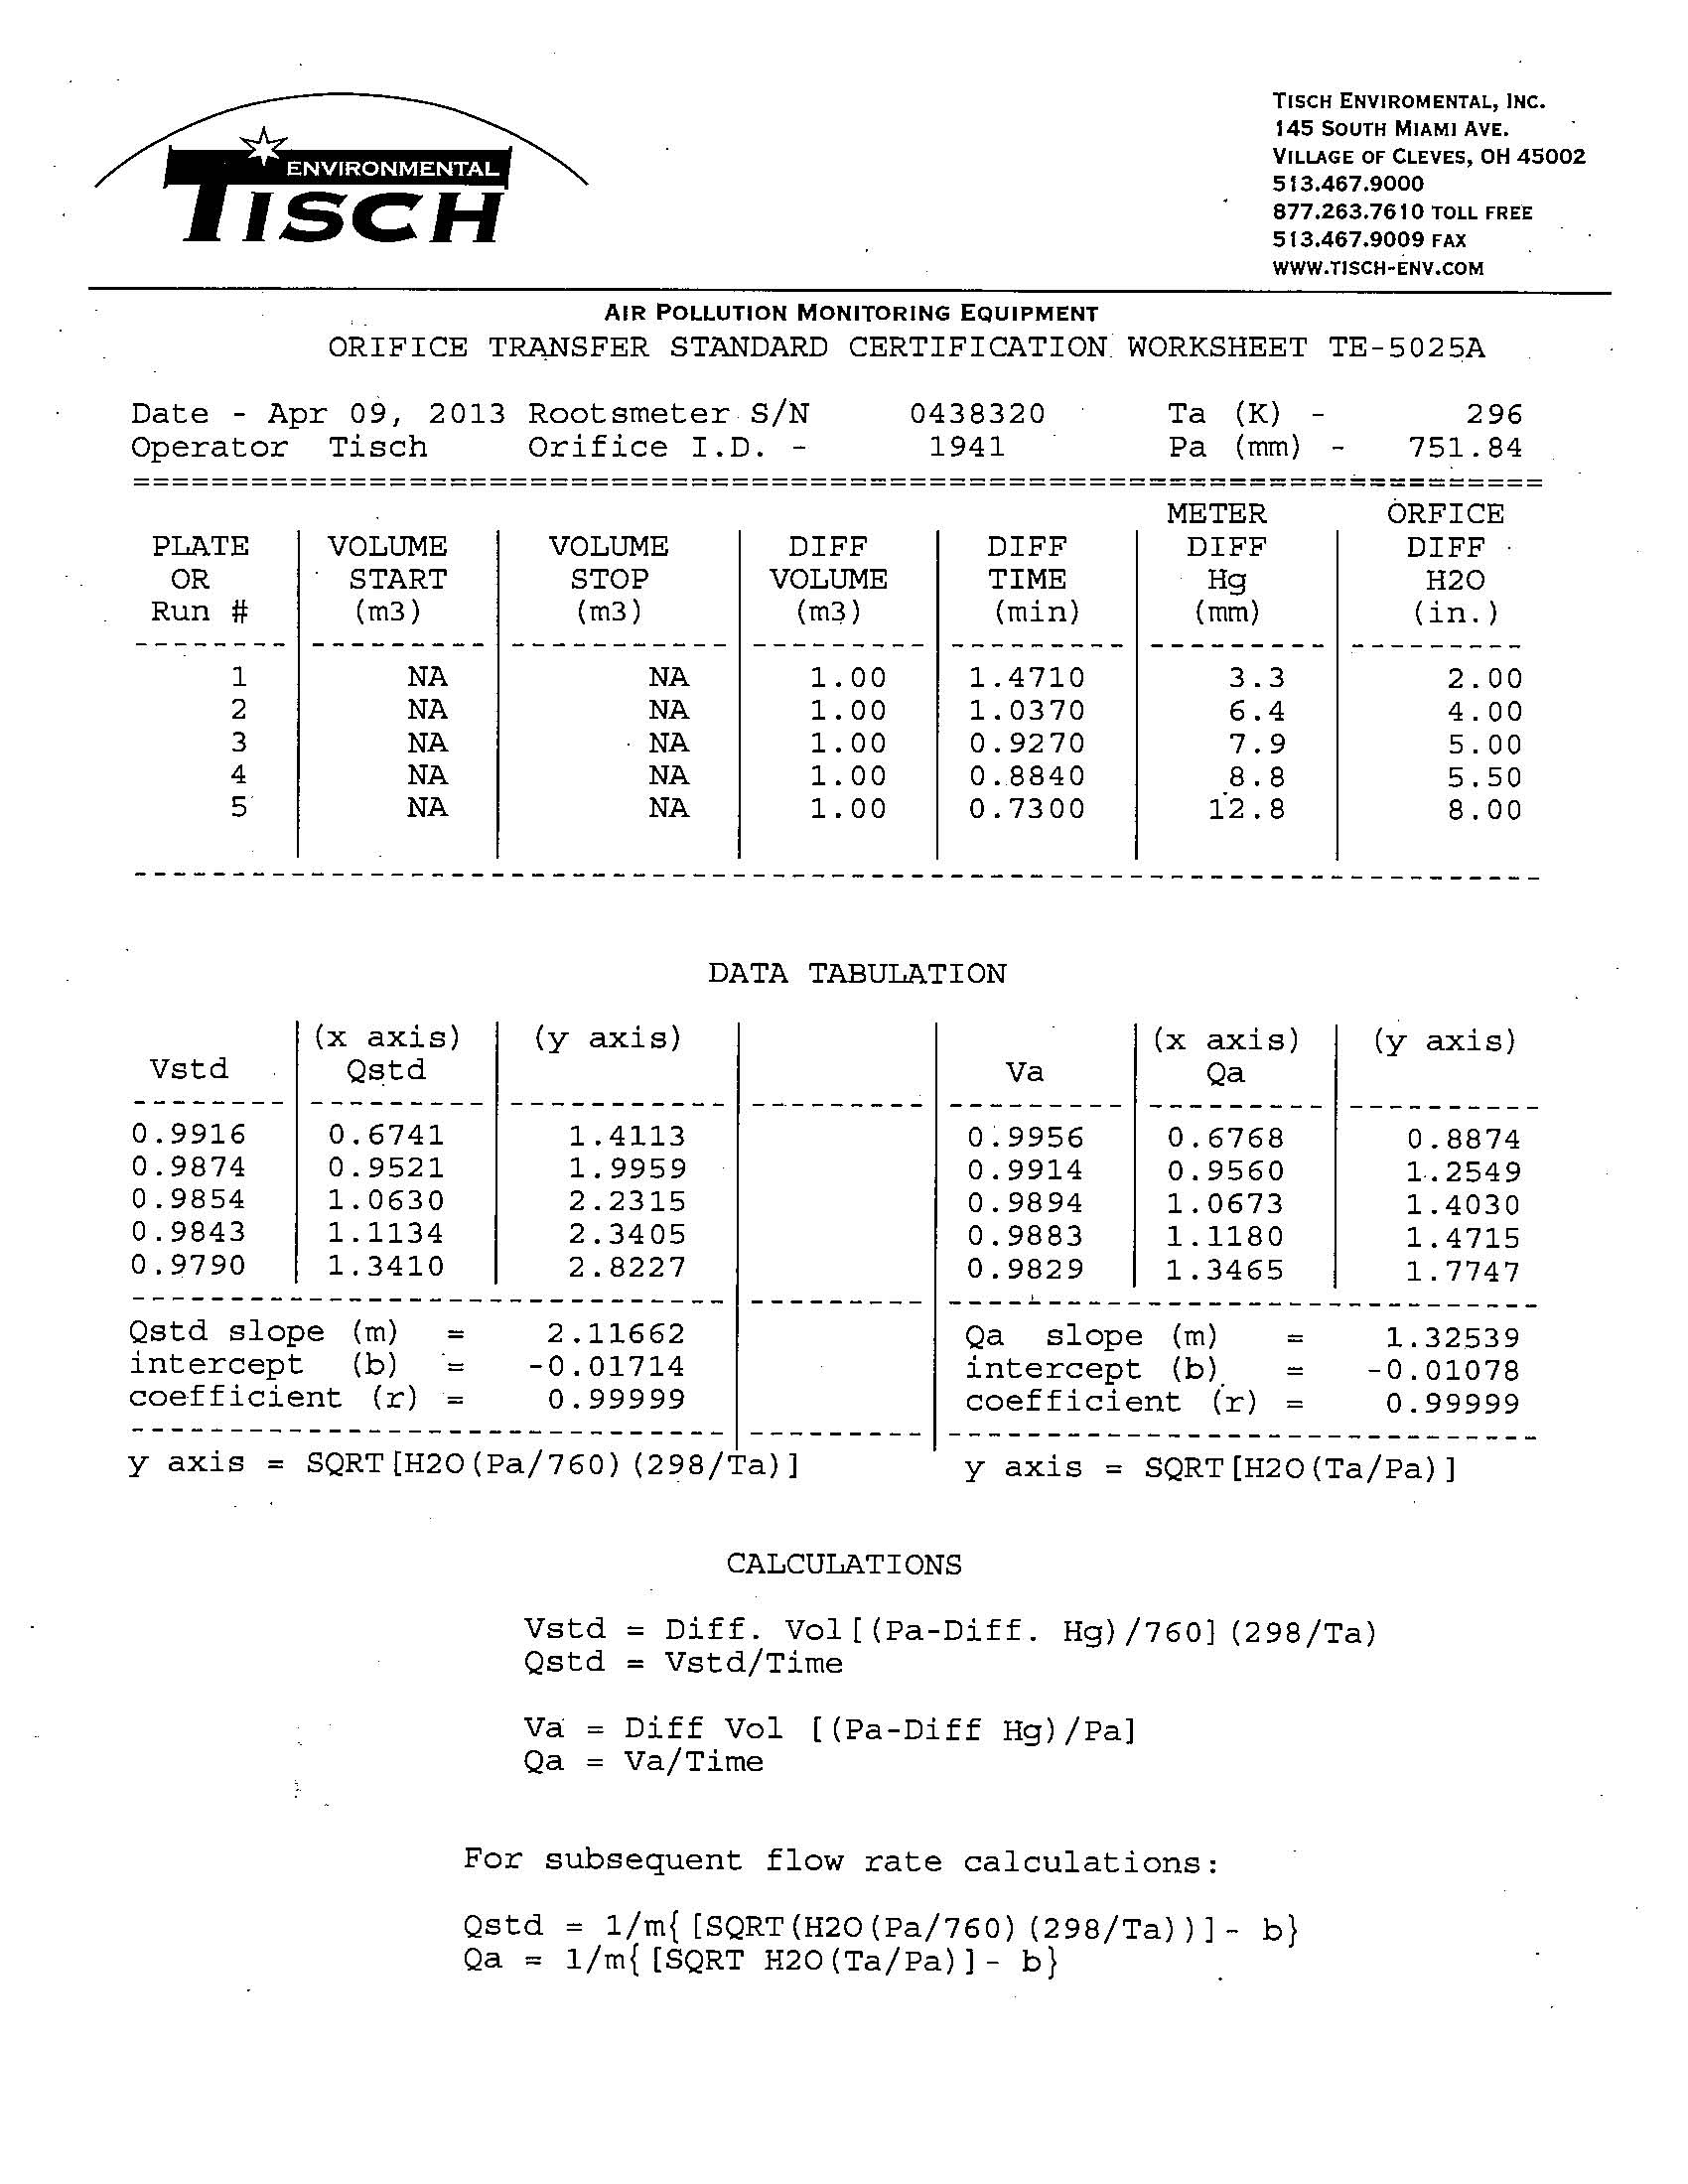
| CALIBRATION ORIFICE Make-> TISCH Model-> 5025A Serial # -> 1941 | Qstd Slope -> 2.11662 Qstd Intercept -> -0.01714 | ||||||
| CALIBRATION | |||||||
| Plate No. | H20 (L) (in) | H2O (R) (in) | H20 (in) | Qstd (m3/min) | I (chart) | IC corrected | LINEAR REGRESSION |
| 18 | 6.8 | 6.8 | 13.6 | 1.734 | 54 | 53.15 | Slope = 44.9590 |
| 13 | 5.7 | 5.7 | 11.4 | 1.588 | 45 | 44.29 | Intercept = -26.1666 |
| 10 | 4.7 | 4.7 | 9.4 | 1.443 | 38 | 37.40 | Corr. coeff. = 0.9960 |
| 7 | 3.4 | 3.4 | 6.8 | 1.228 | 30 | 29.53 | |
| 5 | 2.5 | 2.5 | 5.0 | 1.054 | 22 | 21.65 | |
| Calculations : Qstd = 1/m[Sqrt(H20(Pa/Pstd)(Tstd/Ta))-b] IC = I[Sqrt(Pa/Pstd)(Tstd/Ta)] Qstd = standard flow rate IC = corrected chart respones I = actual chart response m = calibrator Qstd slope b = calibrator Qstd intercept Ta = actual temperature during calibration ( deg K ) Pstd = actual pressure during calibration ( mm Hg ) For subsequent calculation of sampler flow: 1/m(( I )[Sqrt(298/Tav)(Pav/760)]-b) m = sampler slope b = sampler intercept I = chart response Tav = daily average temperature Pav = daily average pressure 0.00 10.00 20.00 30.00 40.00 50.00 60.00 0.000 Actual chart response (IC) | 0.500 1.000 1.500 2.000 Standard Flow Rate (m3/min) FLOW RATE CHART | ||||||
TSP SAMPLER CALIBRATION CALCULATION SPREADSHEET
| Location : Village House near Lin Ma Hang Road Date of Calibration: 26/8/2013 Location ID : AM2 Next Calibration Date: 26/10/2013 Technician: Ben Tam | |||||||
|---|---|---|---|---|---|---|---|
| CONDITIONS Sea Level Pressure (hPa) 1006.8 Corrected Pressure (mm Hg) 755.1 Temperature (oC) 28.8 Temperature (K) 302 | |||||||
| CALIBRATION ORIFICE Make-> TISCH Qstd Slope -> 2.11662 Model-> 5025A Qstd Intercept -> -0.01714 Serial # -> 1941 | |||||||
| CALIBRATION | |||||||
| Plate No. | H20 (L)(in) | H2O (R) (in) | H20 (in) | Qstd (m3/min) | I (chart) | IC corrected | LINEAR REGRESSION |
| 18 13 10 7 5 | 6.5 5.1 3.6 2 1.6 | 6.5 5.1 3.6 2 1.6 | 13.0 10.2 7.2 4.0 3.2 | 1.695 1.503 1.264 0.944 0.845 | 55 49 43 35 30 | 54.13 48.23 42.32 34.45 29.53 | Slope = 27.5878 Intercept = 7.2413 Corr. coeff. = 0.9966 |
| Calculations : Qstd = 1/m[Sqrt(H20(Pa/Pstd)(Tstd/Ta))-b] IC = I[Sqrt(Pa/Pstd)(Tstd/Ta)] Qstd = standard flow rate IC = corrected chart respones I = actual chart response m = calibrator Qstd slope b = calibrator Qstd intercept For subsequent calculation of sampler flow: 1/m(( I )[Sqrt(298/Tav)(Pav/760)]-b) m = sampler slope b = sampler intercept I = chart response Tav = daily average temperature Pav = daily average pressure 0 10 20 30 40 50 60 0 0.5 1 1.5 2 Actual chart response (IC) Standard Flow Rate (m3/min) FLOW RATE CHART | |||||||
TSP SAMPLER CALIBRATION CALCULATION SPREADSHEET
| Location : Ta Kwu Ling Fire Service Station Location ID : AM3 | Date of Calibration: 26/8/2013 Next Calibration Date: 26/10/2013 Technician: Ben Tam | |||||||
|---|---|---|---|---|---|---|---|---|
| CONDITIONS Sea Level Pressure (hPa) 1006.8 Temperature (oC) 28.8 | Corrected Pressure (mm Hg) 755.1 Temperature (K) 302 | |||||||
| CALIBRATION ORIFICE Make-> TISCH Model-> 5025A Serial # -> 1941 | Qstd Slope -> 2.11662 Qstd Intercept -> -0.01714 | |||||||
| CALIBRATION | ||||||||
| Plate No. | H20 (L)(in) | H2O (R) (in) | H20 (in) | Qstd (m3/min) | I (chart) | IC corrected | LINEAR REGRESSION | |
| 18 13 10 7 5 | 6.2 5 3.9 2.8 1.5 | 6.2 5 3.9 2.8 1.5 | 12.4 10.0 7.8 5.6 3.0 | 1.656 1.488 1.315 1.115 0.819 | 56 51 45 36 28 | 55.12 50.20 44.29 35.43 27.56 | Slope = 33.9727 Intercept = -0.9187 Corr. coeff. = 0.9965 | |
| Calculations : Qstd = 1/m[Sqrt(H20(Pa/Pstd)(Tstd/Ta))-b] IC = I[Sqrt(Pa/Pstd)(Tstd/Ta)] Qstd = standard flow rate IC = corrected chart respones I = actual chart response m = calibrator Qstd slope b = calibrator Qstd intercept For subsequent calculation of sampler flow: 1/m(( I )[Sqrt(298/Tav)(Pav/760)]-b) m = sampler slope b = sampler intercept I = chart response Tav = daily average temperature Pav = daily average pressure 0 10 20 30 40 50 60 0 Actual chart response (IC) | 0.5 1 1.5 2 Standard Flow Rate (m3/min) FLOW RATE CHART | |||||||
TSP SAMPLER CALIBRATION CALCULATION SPREADSHEET
| Location : Tsung Yuen Ha Village House No. 63 Date of Calibration: Location ID : AM1 Next Calibration Date: Technician: Ben Tam | 26/10/2013 26/12/2013 | |||||||
|---|---|---|---|---|---|---|---|---|
| CONDITIONS Sea Level Pressure (hPa) 1018.3 Corrected Pressure (mm Hg) Temperature (oC) 22.0 Temperature (K) | 763.725 295 | |||||||
| CALIBRATION ORIFICE Make-> TISCH Qstd Slope -> 2.11662 Model-> 5025A Qstd Intercept -> -0.01714 Serial # -> 1941 |
|
|||||||
| CALIBRATION | ||||||||
| Plate No. | H20 (L)(in) | H2O (R) (in) | H20 (in) | Qstd (m3/min) | I (chart) | IC corrected | LINEAR REGRESSION | |
| 18 | 6.7 | 6.7 | 13.4 | 1.751 | 52 | 52.39 | Slope = 41.6678 | |
| 13 | 5.7 | 5.7 | 11.4 | 1.615 | 45 | 45.34 | Intercept = -21.5030 | |
| 10 | 4.6 | 4.6 | 9.2 | 1.452 | 38 | 38.29 | Corr. coeff. = 0.9978 | |
| 7 | 3.3 | 3.3 | 6.6 | 1.231 | 29 | 29.22 | ||
| 5 | 2.3 | 2.3 | 4.6 | 1.029 | 22 | 22.17 | ||
| Calculations : Qstd = 1/m[Sqrt(H20(Pa/Pstd)(Tstd/Ta))-b] IC = I[Sqrt(Pa/Pstd)(Tstd/Ta)] Qstd = standard flow rate IC = corrected chart respones I = actual chart response m = calibrator Qstd slope b = calibrator Qstd intercept Ta = actual temperature during calibration ( deg K ) Pstd = actual pressure during calibration ( mm Hg ) For subsequent calculation of sampler flow: 1/m(( I )[Sqrt(298/Tav)(Pav/760)]-b) m = sampler slope b = sampler intercept I = chart response Tav = daily average temperature Pav = daily average pressure 0.00 10.00 20.00 30.00 40.00 50.00 60.00 0.000 0.500 1.000 1.500 Actual chart response (IC) Standard Flow Rate (m3/min) FLOW RATE CHART | 2.000 | |||||||
TSP SAMPLER CALIBRATION CALCULATION SPREADSHEET
| Location : Village House near Lin Ma Hang Road Date of Calibration: 26/10/2013 Location ID : AM2 Next Calibration Date: 26/12/2013 Technician: Ben Tam | |||||||
|---|---|---|---|---|---|---|---|
| CONDITIONS Sea Level Pressure (hPa) 1018.3 Corrected Pressure (mm Hg) 763.725 Temperature (oC) 22.0 Temperature (K) 295 | |||||||
| CALIBRATION ORIFICE Make-> TISCH Qstd Slope -> 2.11662 Model-> 5025A Qstd Intercept -> -0.01714 Serial # -> 1941 | |||||||
| CALIBRATION | |||||||
| Plate No. | H20 (L)(in) | H2O (R) (in) | H20 (in) | Qstd (m3/min) | I (chart) | IC corrected | LINEAR REGRESSION |
| 18 13 10 7 5 | 6.6 5.1 3.5 2.1 1.4 | 6.6 5.1 3.5 2.1 1.4 | 13.2 10.2 7.0 4.2 2.8 | 1.738 1.528 1.268 0.984 0.805 | 55 50 43 34 30 | 55.41 50.38 43.32 34.26 30.23 | Slope = 27.6650 Intercept = 7.7418 Corr. coeff. = 0.9988 |
| Calculations : Qstd = 1/m[Sqrt(H20(Pa/Pstd)(Tstd/Ta))-b] IC = I[Sqrt(Pa/Pstd)(Tstd/Ta)] Qstd = standard flow rate IC = corrected chart respones I = actual chart response m = calibrator Qstd slope b = calibrator Qstd intercept For subsequent calculation of sampler flow: 1/m(( I )[Sqrt(298/Tav)(Pav/760)]-b) m = sampler slope b = sampler intercept I = chart response Tav = daily average temperature Pav = daily average pressure 0 10 20 30 40 50 60 0 0.5 1 1.5 2 Actual chart response (IC) Standard Flow Rate (m3/min) FLOW RATE CHART | |||||||
TSP SAMPLER CALIBRATION CALCULATION SPREADSHEET
| Location : Ta Kwu Ling Fire Service Station Location ID : AM3 | Date of Calibration: 26/10/2013 Next Calibration Date: 26/12/2013 Technician: Ben Tam | |||||||
|---|---|---|---|---|---|---|---|---|
| CONDITIONS Sea Level Pressure (hPa) 1018.3 Temperature (oC) 22.0 | Corrected Pressure (mm Hg) 763.725 Temperature (K) 295 | |||||||
| CALIBRATION ORIFICE Make-> TISCH Model-> 5025A Serial # -> 1941 | Qstd Slope -> 2.11662 Qstd Intercept -> -0.01714 | |||||||
| CALIBRATION | ||||||||
| Plate No. | H20 (L)(in) | H2O (R) (in) | H20 (in) | Qstd (m3/min) | I (chart) | IC corrected | LINEAR REGRESSION | |
| 18 13 10 7 5 | 6.2 5 3.9 2.8 1.4 | 6.2 5 3.9 2.8 1.4 | 12.4 10.0 7.8 5.6 2.8 | 1.684 1.513 1.338 1.135 0.805 | 56 50 44 36 27 | 56.42 50.38 44.33 36.27 27.20 | Slope = 33.6390 Intercept = -0.6373 Corr. coeff. = 0.9978 | |
| Calculations : Qstd = 1/m[Sqrt(H20(Pa/Pstd)(Tstd/Ta))-b] IC = I[Sqrt(Pa/Pstd)(Tstd/Ta)] Qstd = standard flow rate IC = corrected chart respones I = actual chart response m = calibrator Qstd slope b = calibrator Qstd intercept For subsequent calculation of sampler flow: 1/m(( I )[Sqrt(298/Tav)(Pav/760)]-b) m = sampler slope b = sampler intercept I = chart response Tav = daily average temperature Pav = daily average pressure 0 10 20 30 40 50 60 0 Actual chart response (IC) | 0.5 1 1.5 2 Standard Flow Rate (m3/min) FLOW RATE CHART | |||||||