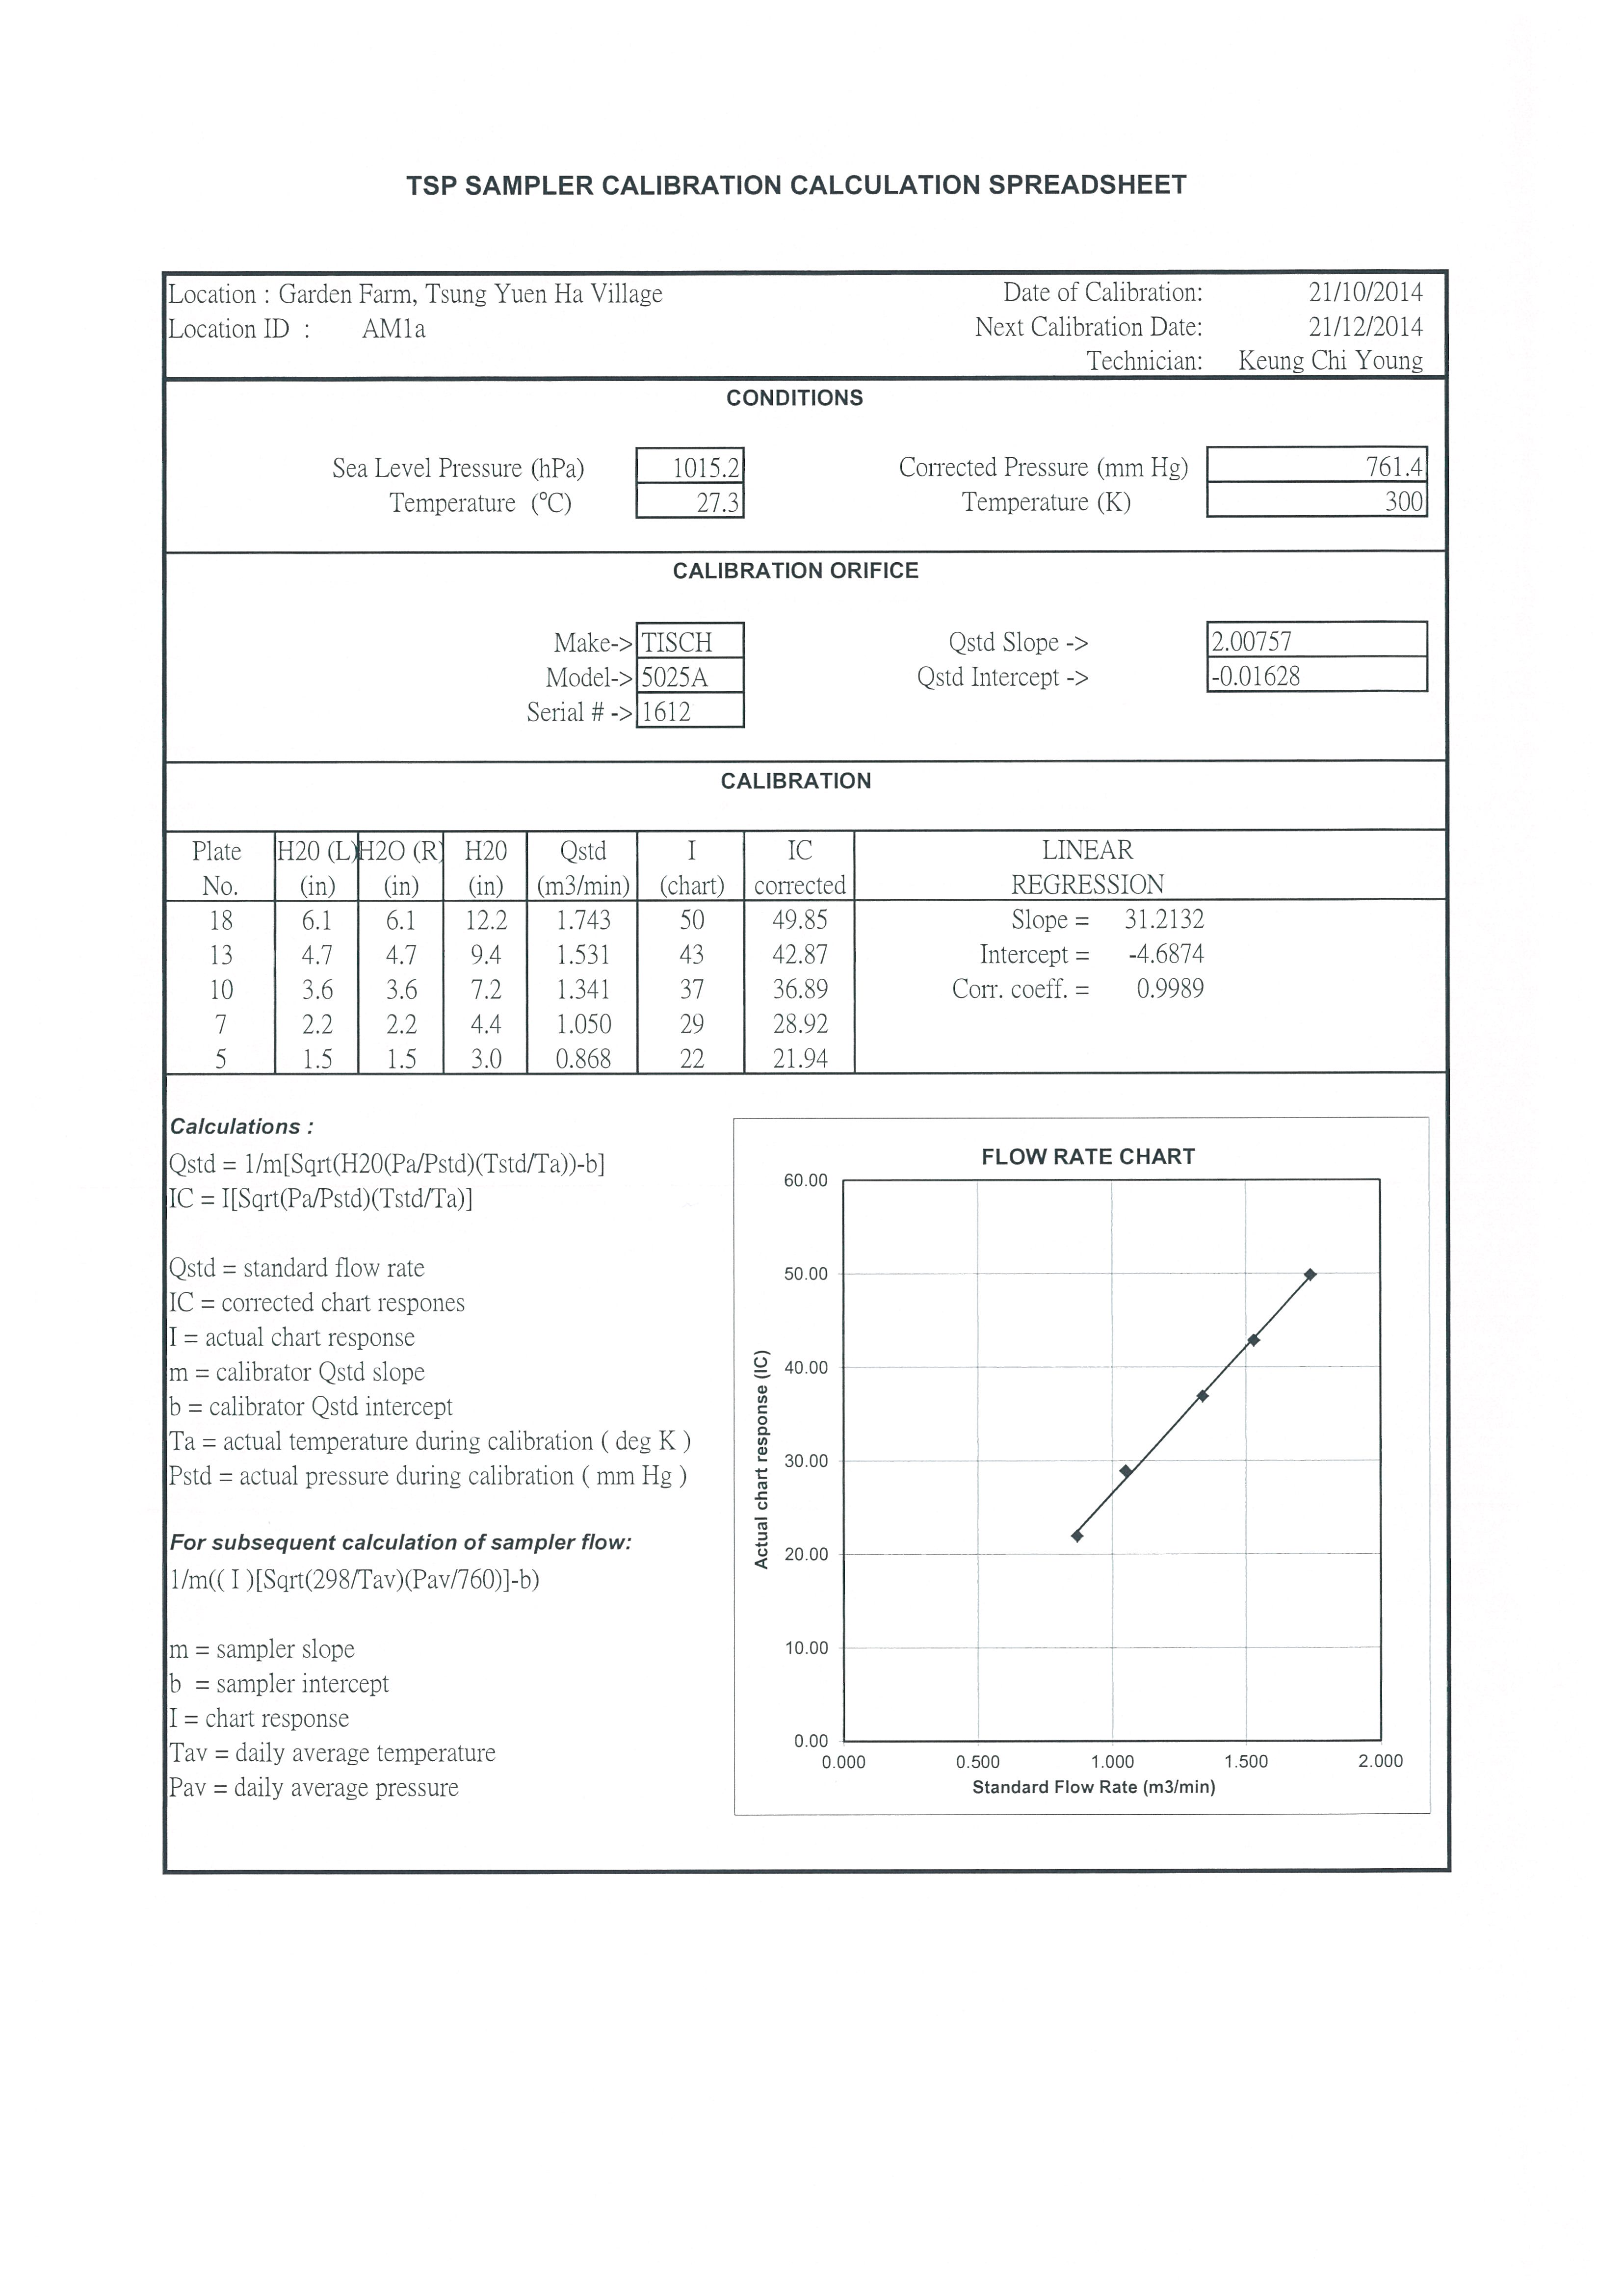
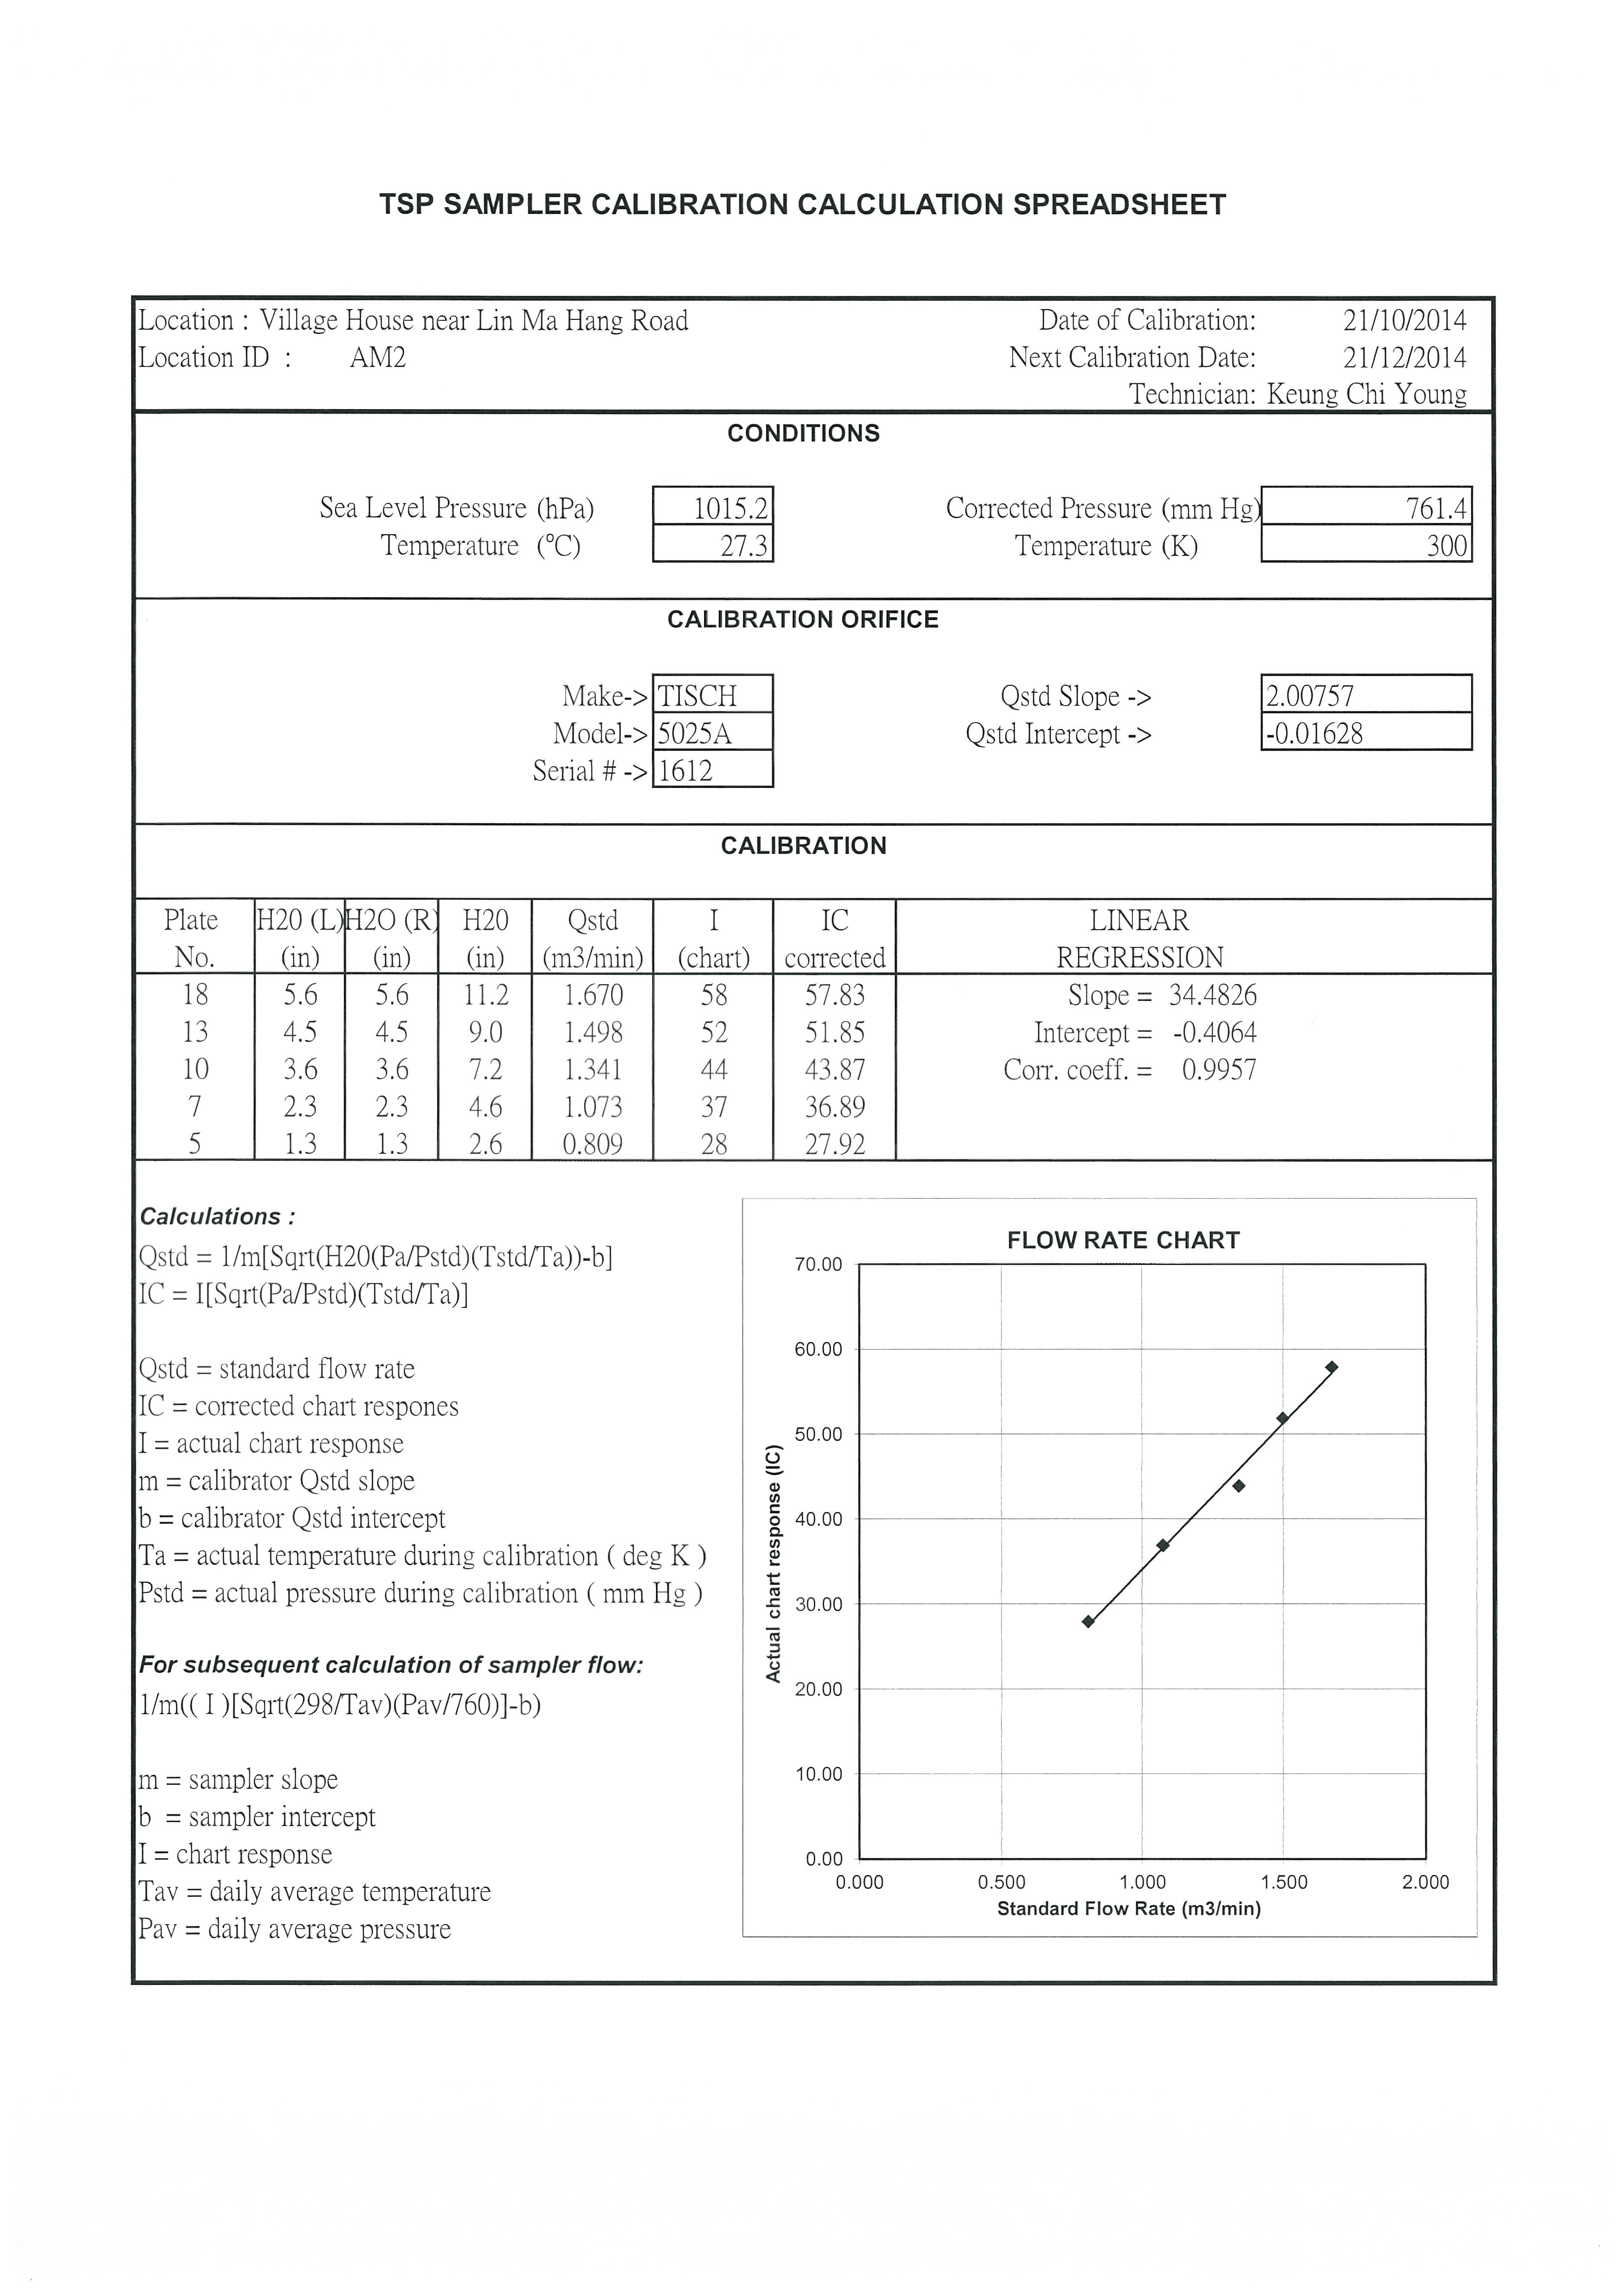
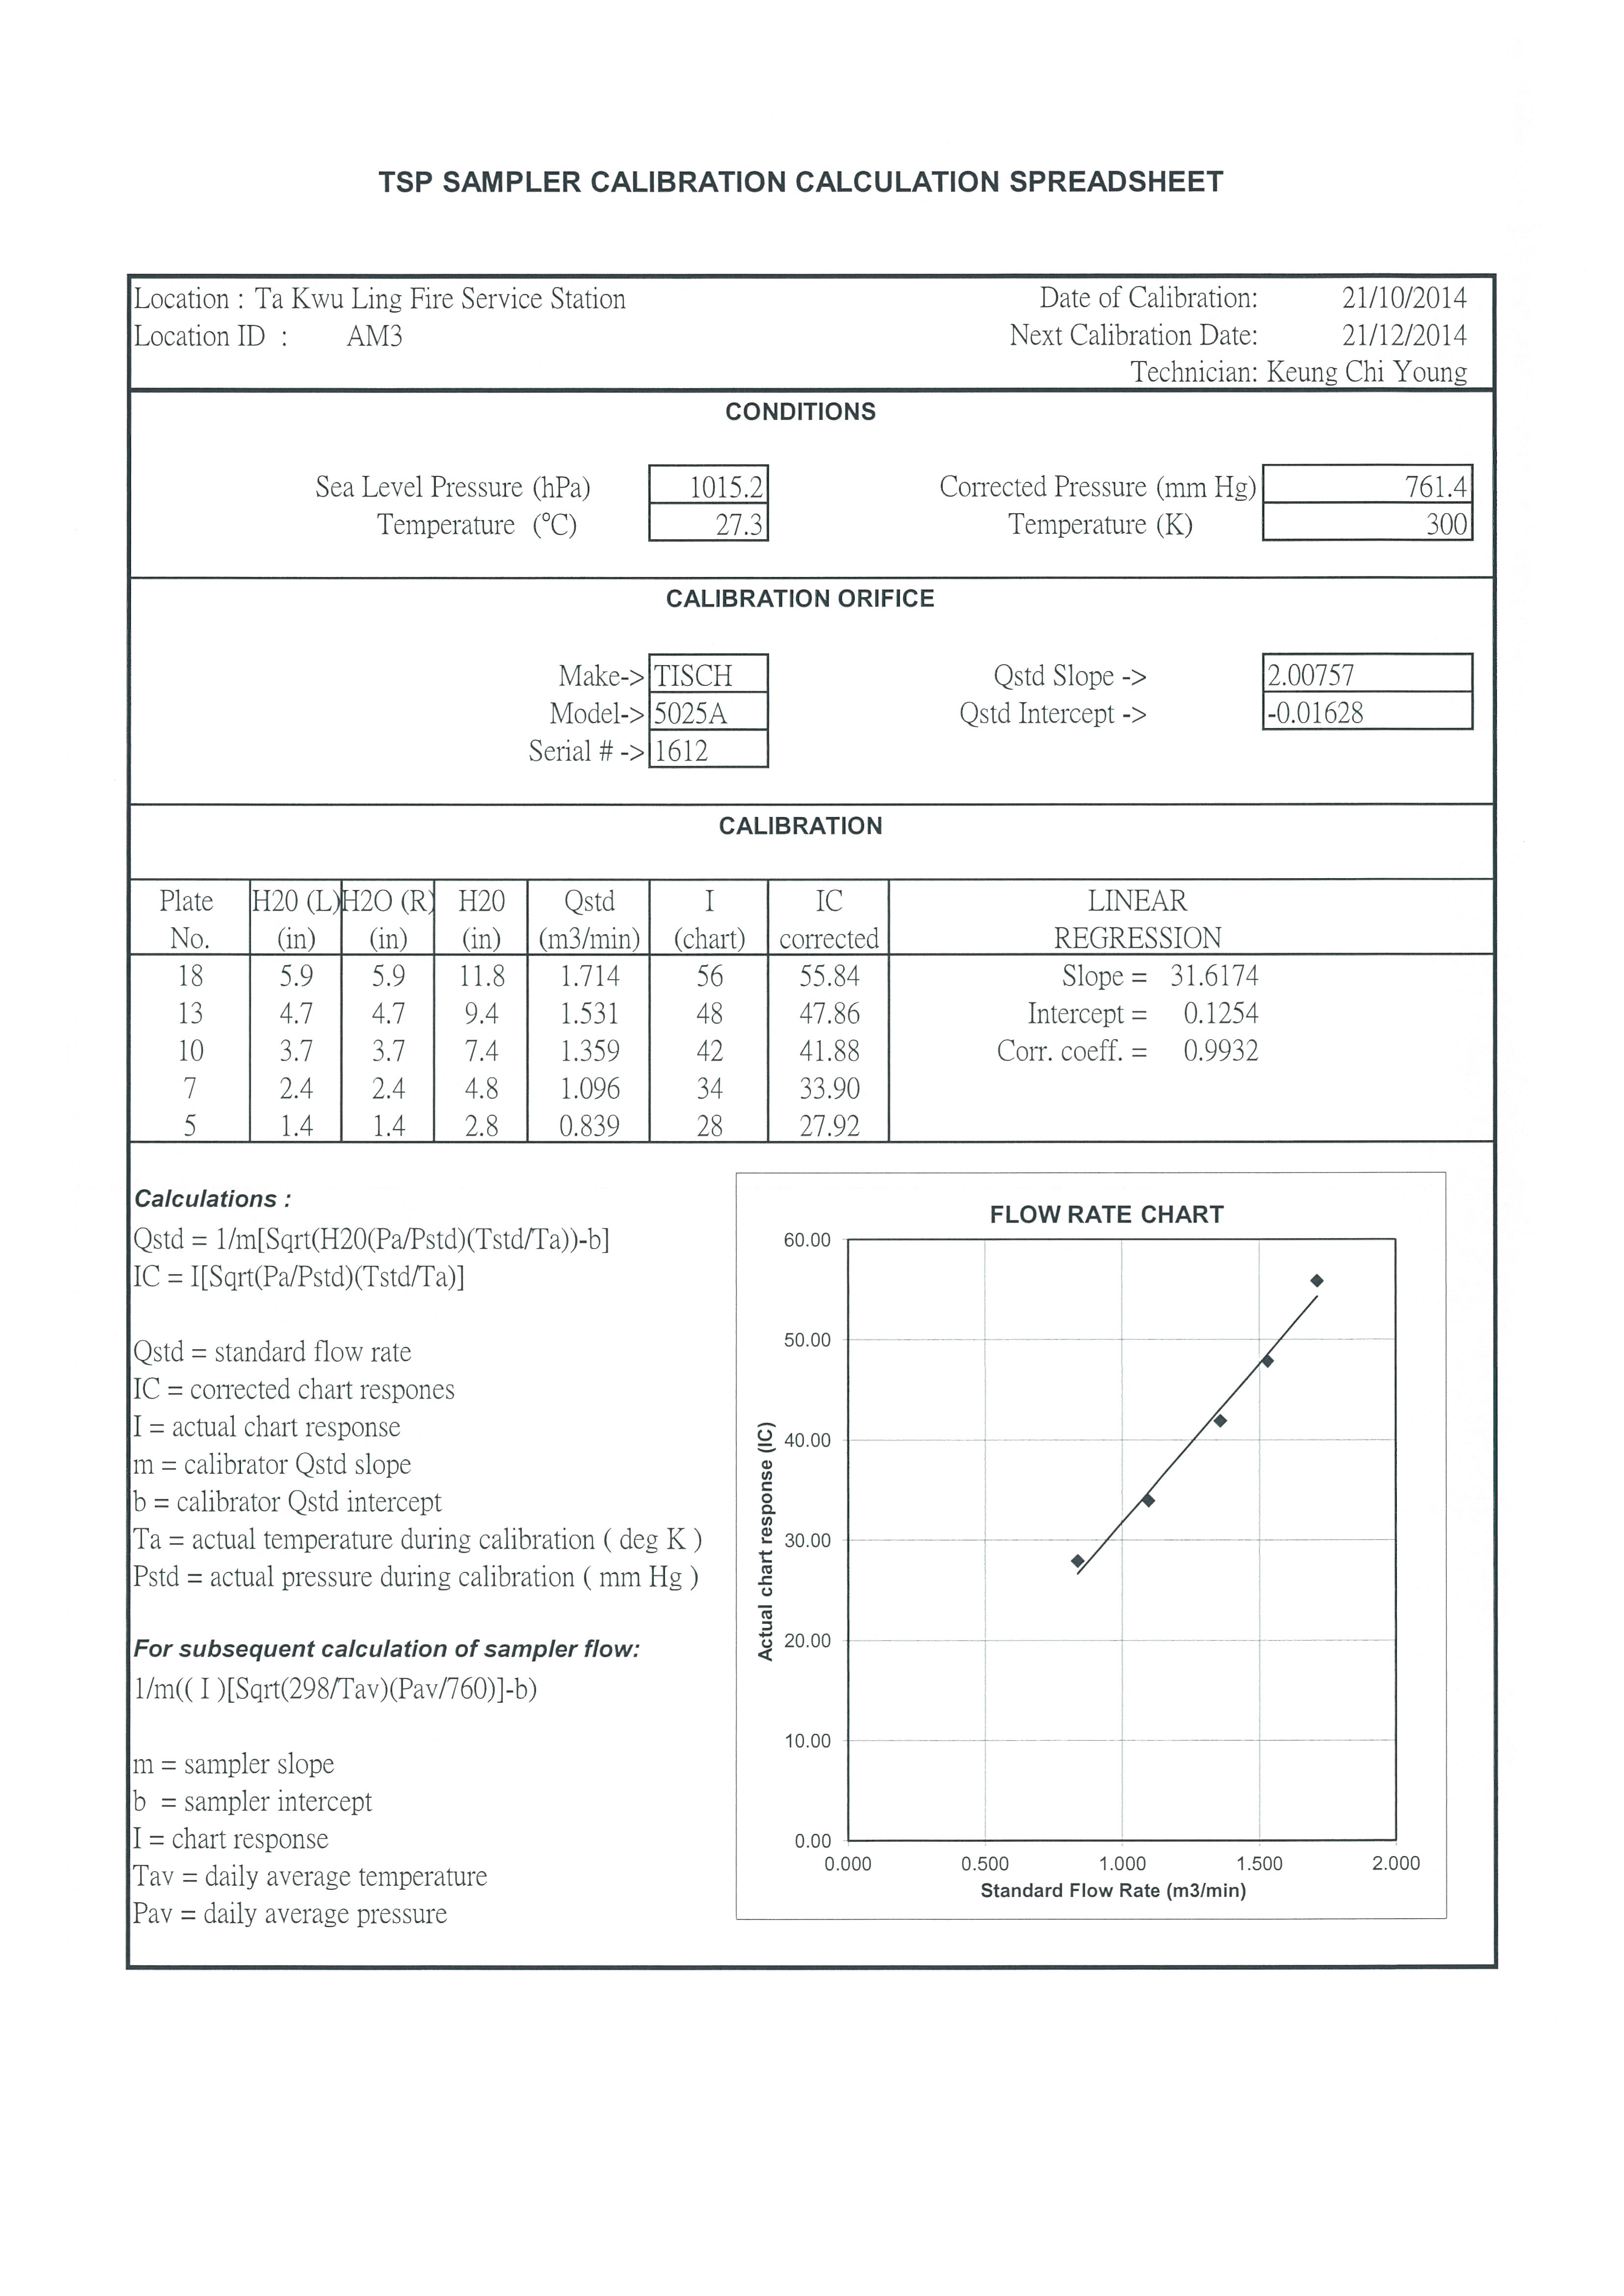

TSP SAMPLER CALIBRATION CALCULATION SPREADSHEET
| Location : Gold King Industrial Building, Kwai Chung Location ID : Calibration Room | Date of Calibration: 6-Jan-14 Next Calibration Date: 6-Apr-14 | |||||||
|---|---|---|---|---|---|---|---|---|
| CONDITIONS Sea Level Pressure (hPa) 1018 Temperature (oC) 18.5 | Corrected Pressure (mm Hg) 763.5 Temperature (K) 292 | |||||||
| CALIBRATION ORIFICE Make-> TISCH Model-> 5025A Calibration Date-> 9-Apr-13 | Qstd Slope -> 2.11662 Qstd Intercept -> -0.01714 Expiry Date-> 9-Apr-14 | |||||||
| CALIBRATION | ||||||||
| Plate No. | H20 (L)(in) | H2O (R) (in) | H20 (in) | Qstd (m3/min) | I (chart) | IC corrected | LINEAR REGRESSION | |
| 18 | 5.8 | 5.8 | 11.6 | 1.639 | 56 | 56.75 | Slope = 23.4751 | |
| 13 | 4.6 | 4.6 | 9.2 | 1.460 | 50 | 50.67 | Intercept = 17.5690 | |
| 10 | 2.8 | 2.8 | 5.6 | 1.141 | 44 | 44.59 | Corr. coeff. = 0.9966 | |
| 8 | 1.6 | 1.6 | 3.2 | 0.865 | 38 | 38.51 | ||
| 5 | 0.9 | 0.9 | 1.8 | 0.650 | 32 | 32.43 | ||
| Calculations : Qstd = 1/m[Sqrt(H20(Pa/Pstd)(Tstd/Ta))-b] IC = I[Sqrt(Pa/Pstd)(Tstd/Ta)] Qstd = standard flow rate IC = corrected chart respones I = actual chart response m = calibrator Qstd slope b = calibrator Qstd intercept Ta = actual temperature during calibration ( deg K ) Pstd = actual pressure during calibration ( mm Hg ) For subsequent calculation of sampler flow: 1/m(( I )[Sqrt(298/Tav)(Pav/760)]-b) m = sampler slope b = sampler intercept I = chart response Tav = daily average temperature Pav = daily average pressure 0.00 10.00 20.00 30.00 40.00 50.00 60.00 0.000 Actual chart response (IC) | 0.500 1.000 1.500 2.000 Standard Flow Rate (m3/min) FLOW RATE CHART | |||||||