Appendix I - Monthly Summary Waste Flow Table for 2016
(All quantities shall be rounded off to 3 decimal places)
|
Month |
Actual Quantities of Inert C&D Materials Generated / Imported (in '000 m3) |
|
|
Actual Quantities of Other C&D Materials / Wastes Generated |
|
|
Total Quantities Generated [a+b+c+d) |
Broken Concrete (including rock for recycling into aggregates) (a) |
Reused in the Contract (b) |
Reused in Other Projects (c) |
Disposed as Public Fill (d) |
Imported C&D Material |
Metal (in '000kg) |
Paper/ Cardboard Packaging (in '000kg) |
Plastic (bottles/containers, plastic sheets/ foams from package material) (in '000kg) |
Chemical Waste (in '000kg) |
Others (e.g. General Refuse etc.) (in '000m3) |
|
January |
72.2029 |
0.0000 |
0.6482 |
31.8061 |
39.7486 |
0.7684 |
0.0000 |
0.0000 |
0.0000 |
1.2320 |
0.1247 |
|
February |
55.6715 |
0.0000 |
1.0145 |
38.3484 |
16.3085 |
0.9343 |
0.0000 |
0.0000 |
0.0000 |
0.8800 |
0.1089 |
|
March |
0.0000 |
|
|
|
|
|
|
|
|
|
|
|
April |
0.0000 |
|
|
|
|
|
|
|
|
|
|
|
May |
0.0000 |
|
|
|
|
|
|
|
|
|
|
|
June |
0.0000 |
|
|
|
|
|
|
|
|
|
|
|
Half-year total |
127.8744 |
0.0000 |
1.6627 |
70.1545 |
56.0571 |
1.7027 |
0.0000 |
0.0000 |
0.0000 |
2.1120 |
0.2336 |
|
July |
0.0000 |
|
|
|
|
|
|
|
|
|
|
|
August |
0.0000 |
|
|
|
|
|
|
|
|
|
|
|
September |
0.0000 |
|
|
|
|
|
|
|
|
|
|
|
October |
0.0000 |
|
|
|
|
|
|
|
|
|
|
|
November |
0.0000 |
|
|
|
|
|
|
|
|
|
|
|
December |
0.0000 |
|
|
|
|
|
|
|
|
|
|
|
Yearly Total |
127.8744 |
0.0000 |
1.6627 |
70.1545 |
56.0571 |
1.7027 |
0.0000 |
0.0000 |
0.0000 |
2.1120 |
0.2336 |
(All quantities shall be rounded off to 3 decimal places)
|
Year |
Actual Quantities of Inert C&D Materials Generated / Imported (in '000 m3) |
|
|
Actual Quantities of Other C&D Materials / Wastes Generated |
|
|
Total Quantities Generated [a+b+c+d) |
Broken Concrete (including rock for recycling into aggregates) (a) |
Reused in the Contract (b) |
Reused in Other Projects (c) |
Disposed as Public Fill (d) |
Imported C&D Material |
Metal (in '000kg) |
Paper/ Cardboard Packaging (in '000kg) |
Plastic (bottles/containers, plastic sheets/ foams from package material) (in '000kg) |
Chemical Waste (in '000kg) |
Others (e.g. General Refuse etc.) (in '000m3) |
|
2013 |
0.0000 |
0.0000 |
0.0000 |
0.0000 |
0.0000 |
0.0000 |
0.0000 |
0.0000 |
0.0000 |
0.0000 |
0.0000 |
|
2014 |
425.4406 |
0.0000 |
2.7362 |
376.3945 |
46.3099 |
5.6245 |
3.2100 |
0.4390 |
0.0070 |
10.8800 |
2.2609 |
|
2015 |
570.9459 |
0.0000 |
20.8159 |
543.2162 |
6.9138 |
4.5492 |
14.1300 |
3.9220 |
1.5000 |
16.1920 |
1.1696 |
|
2016 |
127.8744 |
0.0000 |
1.6627 |
70.1545 |
56.0571 |
1.7027 |
0.0000 |
0.0000 |
0.0000 |
2.1120 |
0.2336 |
|
2017 |
|
|
|
|
|
|
|
|
|
|
|
|
2018 |
|
|
|
|
|
|
|
|
|
|
|
|
Total |
1124.2609 |
0.0000 |
25.2148 |
989.7653 |
109.2808 |
11.8764 |
17.3400 |
4.3610 |
1.5070 |
29.1840 |
3.6641 |
|
Remark: |
|
|
1) Density of C&D material to be |
2.2 |
metric ton/m3 |
3) Density of Spent Oil to be |
0.88 |
metric ton/m3 |
|
2) Density of General Refuse to be |
1.6 |
metric ton/m3 |
|
|
|
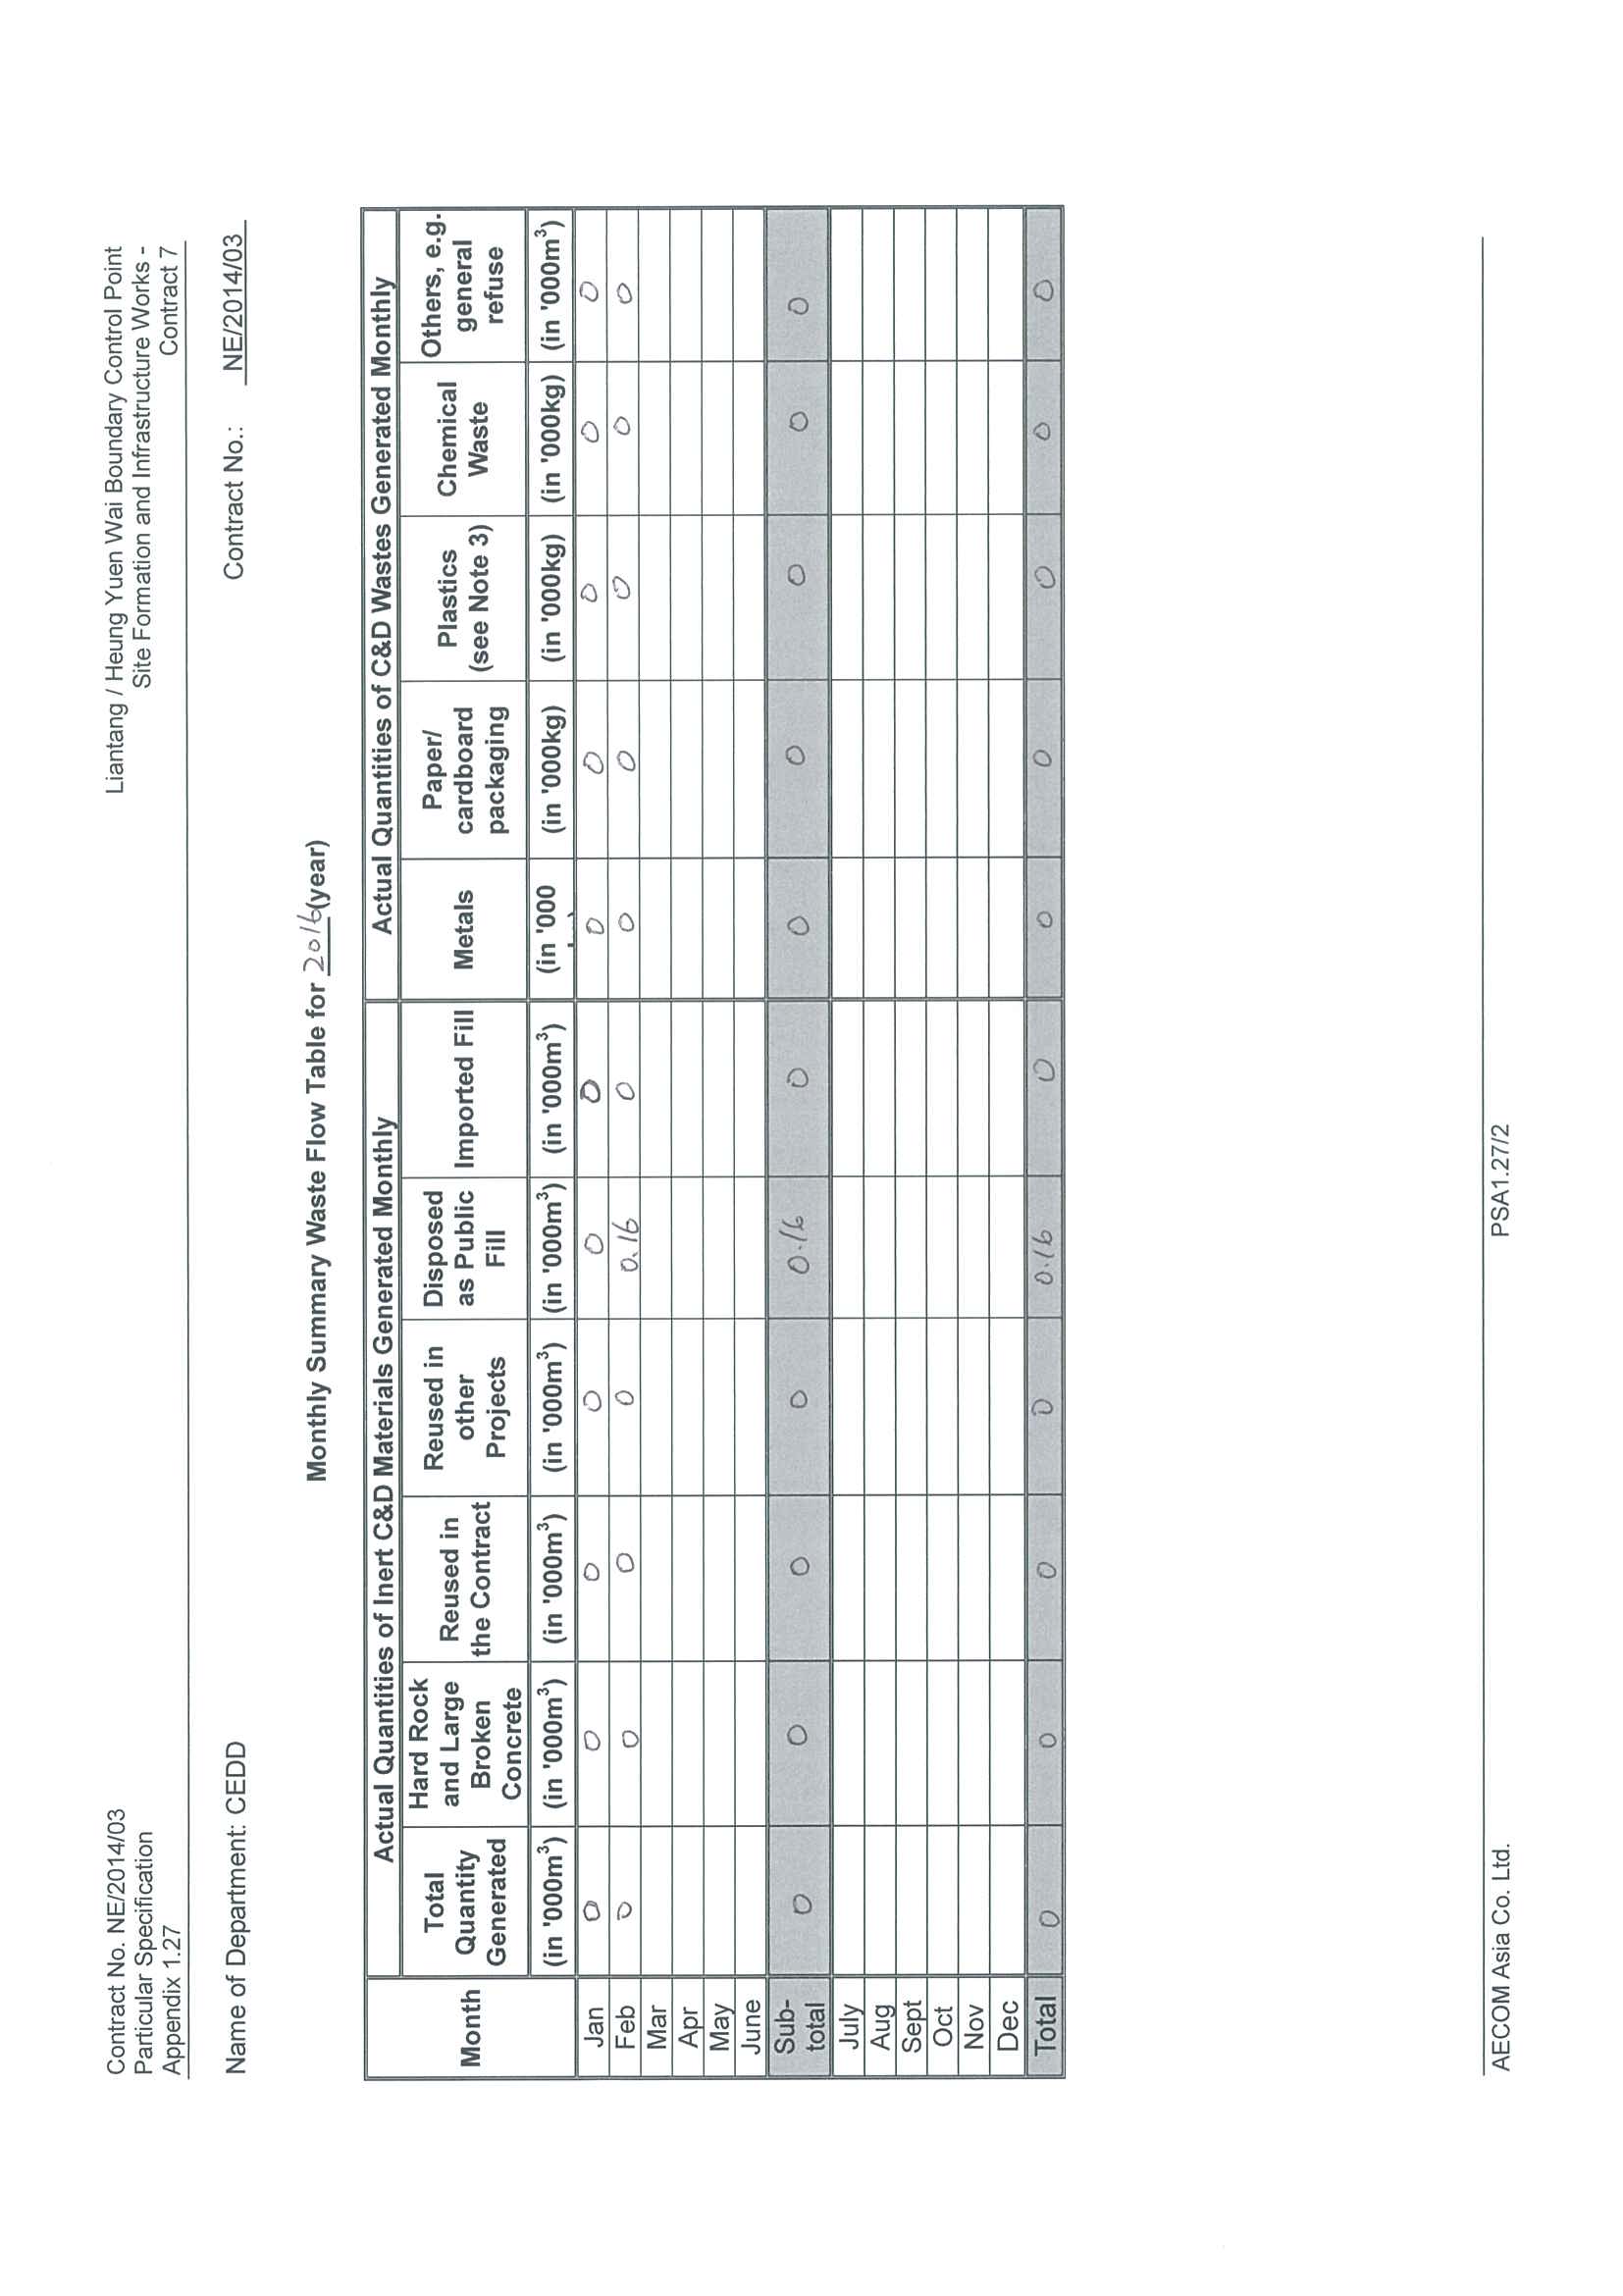
Name of Department: CEDD Contract No.: CV/2012/09
Monthly Summary Waste Flow Table for 2016 (year)
|
Month |
Actual Quantities of Inert C&D Materials Generated Monthly |
Actual Quantities of C&D Wastes Generated Monthly |
|
Total Quantity Generated |
Hard Rock and Large Broken Concrete |
Reused in the Contract |
Reused in other Projects |
Disposed as Public Fill |
Imported Fill |
Metals |
Paper/ cardboard packaging |
Plastics |
Chemical Waste |
Others, e.g. general refuse |
|
(in '000m3) |
(in '000m3) |
(in '000m3) |
(in '000m3) |
(in '000m3) |
(in '000m3) |
(in '000m3) |
(in '000m3) |
(in '000m3) |
(in m3) |
(in '000m3) |
|
Jan |
2.430 |
0.253 |
0.030 |
0.000 |
2.400 |
0.799 |
0.001 |
0.000 |
0.000 |
0.000 |
0.115 |
|
Feb |
1.225 |
0.651 |
0.020 |
0.000 |
1.205 |
1.141 |
0.000 |
0.000 |
0.000 |
0.000 |
0.110 |
|
Mar |
|
|
|
|
|
|
|
|
|
|
|
|
Apr |
|
|
|
|
|
|
|
|
|
|
|
|
May |
|
|
|
|
|
|
|
|
|
|
|
|
Jun |
|
|
|
|
|
|
|
|
|
|
|
|
Sub-total |
3.655 |
0.904 |
0.050 |
0.000 |
3.605 |
1.940 |
0.001 |
0.000 |
0.000 |
0.000 |
0.225 |
|
Jul |
|
|
|
|
|
|
|
|
|
|
|
|
Aug |
|
|
|
|
|
|
|
|
|
|
|
|
Sep |
|
|
|
|
|
|
|
|
|
|
|
|
Oct |
|
|
|
|
|
|
|
|
|
|
|
|
Nov |
|
|
|
|
|
|
|
|
|
|
|
|
Dec |
|
|
|
|
|
|
|
|
|
|
|
|
Total |
3.655 |
0.904 |
0.050 |
0.000 |
3.605 |
1.940 |
0.001 |
0.000 |
0.000 |
0.000 |
0.225 |
Note: 1. Assume the density of soil fill is 2 ton/m3 .
-
Assume the density of rock and broken concrete is 2.5 ton/m3 .
-
Assume each truck of C&D wastes is 5m3 .
-
The inert C&D materials except slurry and bentonite are disposed at Tuen Mun 38.
-
The slurry and bentonite are disposed at Tseung Kwun O 137.
-
The non-inert C&D wastes are disposed at NENT.
-
Assume the density of metal is 7,850 kg/m3 .
|
Contract No. CV/2013/03 Particular Specification Appendix 1.27 |
|
Liantang/Heung Yuen Wai Boundary Control Point Site Formation and infrastructure Works Contract 5 |
|
Name of Department: CEDD |
|
|
|
Monthly Summary Waste Flow Table for 2016 |
|
|
Month |
Actual Quantities of Inert C&D Materials Generated Monthly |
Actual Quantities of C&D Wastes Generated Monthly |
|
Total Quantity Generated |
Hard Rock and Large Broken Concrete |
Reused in the Contract |
Reused in other Projects |
Disposed as Public Fill |
Imported Fill |
Metals |
Paper/ cardboard packaging |
Plastics |
Chemical Waste |
Others, e.g. general refuse |
|
(in '000m3) |
(in '000m3) |
(in '000m3) |
(in '000m3) |
(in '000m3) |
(in '000m3) |
(in '000kg) |
(in '000kg) |
(in '000kg) |
(in '000kg) |
(in '000m3) |
|
JAN |
0 |
0 |
0 |
0 |
0 |
0.235 |
0 |
0 |
0 |
0 |
0.06 |
|
FEB |
0 |
0 |
0 |
0 |
0 |
0.141 |
0 |
0 |
0 |
0 |
0.045 |
|
MAR |
|
|
|
|
|
|
|
|
|
|
|
|
APRIL |
|
|
|
|
|
|
|
|
|
|
|
|
MAY |
|
|
|
|
|
|
|
|
|
|
|
|
JUN |
|
|
|
|
|
|
|
|
|
|
|
|
Sub Total |
0 |
0 |
0 |
0 |
0 |
0.376 |
0 |
0 |
0 |
0 |
0.105 |
|
JUL |
|
|
|
|
|
|
|
|
|
|
|
|
AUG |
|
|
|
|
|
|
|
|
|
|
|
|
SEP |
|
|
|
|
|
|
|
|
|
|
|
|
OCT |
|
|
|
|
|
|
|
|
|
|
|
|
NOV |
|
|
|
|
|
|
|
|
|
|
|
|
DEC |
|
|
|
|
|
|
|
|
|
|
|
|
Total |
0 |
0 |
0 |
0 |
0 |
0.38 |
0 |
0 |
0 |
0 |
0.105 |
Notes:
Contract No. CV/2013/03 Particular Specification Appendix 1.27
Name of Department: CEDD
Liantang/Heung Yuen Wai Boundary Control Point Site Formation and infrastructure Works Contract 5
|
Forecast of Total Quantities of C&D Materials to be Generated from the Contract (see Note 4) |
|
|
|
Total Quantity Generated |
Hard Rocks and Large Broken Concrete |
Reused in the Contract |
Reused in Other Projects |
Disposed as Public Fill |
Imported Fill |
Metal |
Paper / cardboard packaging |
Plastics (see Note 3) |
Chemical Waste |
Others, e.g. general refuse |
|
(in '000m3) |
(in '000m3) |
(in '000m3) |
(in '000m3) |
(in '000m3) |
(in '000m3) |
(in '000kg) |
(in '000kg) |
(in '000kg) |
(in '000kg) |
(in '000m3) |
|
0 |
0 |
0 |
0 |
0 |
350 |
30 |
4 |
2 |
1 |
4 |
Notes:
-
(1)
-
The performance targets are given in PS clause 6(14) above.
-
(2)
-
The waste flow table shall also include C&D materials that are specified in the Contractor to be imported for use at the Site.
-
(3)
-
Plastic refer to plastic bottles/containers, plastic sheets/foam from packaging material.
-
(4)
-
The Contractor shall also submit the latest forecast of the total amount of C&D materials expected to be generated from the Works, together with a breakdown of the nature
- Hard Rocks and Large Broken Concrete = Cannot be defined at this stage
-Imported Fill = Estimated by the Contractor = 1 loading = 8m 3
-Metal = Estimated by the Contractor
-Paper/cardboard packaging = Estimated by the Contractor
-Plastics = Estimated by the Contractor
- Chemical Waste = Estimated by the Contractor (Spent lubricating oil, assume density 0.9kg/L)
-Other, e.g. general refuse = Estimated by the Contractor
Monthly Summary Waste Flow Table for 2016 (year)
Name of Person completing the record: KM LUI (EO)
Project : Liangtang / Heung Yuen Wai Boundary Control Point Site Formation and Infrastructure Works – Contract 6 Contract No.: CV/2013/08
|
Month |
Actual Quantities of Inert C&D Materials Generated Monthly |
Actual Quantities of C&D Wastes Generated Monthly |
|
Total Quantity Generated |
Hard Rock and Large Broken Concrete |
Reused in the Contract |
Reused in other Projects |
Disposed as Public Fill |
Imported Fill |
Metals |
Paper/ cardboard packaging |
Plastics (see Note 3) |
Chemical Waste |
Others, e.g. general refuse |
|
(in '000m3) |
(in '000m3) |
(in '000m3) |
(in '000m3) |
(in '000m3) |
(in ‘000m3) |
(in '000 kg) |
(in '000kg) |
(in '000kg) |
(in '000kg) |
(in ‘000 m3) |
|
Jan |
58.943 |
0 |
3.811 |
12.131 |
43.001 |
31.248 |
0 |
0 |
0 |
0 |
0.695 |
|
Feb |
74.418 |
0 |
8.785 |
39.85 |
25.783 |
6.552 |
0 |
0.097 |
0 |
0 |
0.339 |
|
Mar |
|
|
|
|
|
|
|
|
|
|
|
|
Apr |
|
|
|
|
|
|
|
|
|
|
|
|
May |
|
|
|
|
|
|
|
|
|
|
|
|
Jun |
|
|
|
|
|
|
|
|
|
|
|
|
Sub-total |
133.361 |
0 |
12.596 |
51.981 |
68.784 |
37.8 |
0 |
0.097 |
0 |
0 |
1.034 |
|
Jul |
|
|
|
|
|
|
|
|
|
|
|
|
Aug |
|
|
|
|
|
|
|
|
|
|
|
|
Sep |
|
|
|
|
|
|
|
|
|
|
|
|
Oct |
|
|
|
|
|
|
|
|
|
|
|
|
Nov |
|
|
|
|
|
|
|
|
|
|
|
|
Dec |
|
|
|
|
|
|
|
|
|
|
|
|
Total |
302.584 |
0 |
31.13 |
68.765 |
202.689 |
45.049 |
0 |
0.391 |
0 |
32.28 |
4.11 |
Notes: (1) The waste flow table shall also include C&D materials that are specified in the Contract to be imported for use at the Site.
-
(2)
-
Plastics refer to plastic bottles/containers, plastic sheets/ foam from packaging materials.
-
(3)
-
Broken concrete for recycling into aggregates.
|
Architectural Services Department |
Form No. D/OI.03/09.002 |
SSC505
Contract No. / Works Order No.:
Monthly Summary Waste Flow Table for 2016 [year] [to be submitted not later than the 15th day of each month following reporting month] (All quantities shall be rounded off to 3 decimal places.)
|
Month |
|
Actual Quantities of Inert Construction Waste Generated Monthly |
|
|
(a)=(b)+(c)+(d)+(e) Total Quantity Generated |
(b) Broken Concrete (see Note 4) |
(c) Reused in the Contract |
(d) Reused in other Projects |
(e) Disposed of as Public Fill |
|
(in ‘000m3) |
(in ‘000m3) |
(in ‘000m3) |
(in ‘000m3) |
(in ‘000m3) |
|
Jan |
0.800 |
0 |
0 |
0 |
0.800 |
|
Feb |
0.858 |
0 |
0 |
0 |
0.858 |
|
Mar |
|
|
|
|
|
|
Apr |
|
|
|
|
|
|
May |
|
|
|
|
|
|
Jun |
|
|
|
|
|
|
Sub-total |
1.658 |
0 |
0 |
0 |
1.658 |
|
Jul |
|
|
|
|
|
|
Aug |
|
|
|
|
|
|
Sep |
|
|
|
|
|
|
Oct |
|
|
|
|
|
|
Nov |
|
|
|
|
|
|
Dec |
|
|
|
|
|
|
Total |
1.658 |
0 |
0 |
0 |
1.658 |
Architectural Services Department First Issue Date -20 : 07 : 2009
Standard Form No. D/OI.03/09.002 Current Issue Date -21 : 09 : 2011
Page 1
|
Architectural Services Department |
Form No. D/OI.03/09.002 |
|
Month |
|
|
Actual Quantities of Non-inert Construction Waste Generated Monthly |
|
|
|
Timber |
Metals |
Paper/ cardboard packaging |
Plastics (see Note 3) |
Chemical Waste |
Other Recyclable Materials _________________ (see Page 3) |
General Refuse disposed of at Landfill |
|
(in ‘000kg) |
(in ‘000kg) |
(in ‘000kg) |
(in ‘000kg) |
(in ‘000kg) |
(in ‘000kg) |
(in ‘000m3) |
|
generated |
recycled |
generated |
recycled |
generated |
recycled |
generated |
recycled |
generated |
recycled |
generated |
recycled |
generated |
|
Jan |
0.000 |
0.000 |
4.73 |
4.73 |
0.000 |
0.000 |
0.000 |
0.000 |
0.000 |
0.000 |
0.000 |
0.000 |
0.072 |
|
Feb |
0.000 |
0.000 |
0.0004 |
0.0004 |
0.0186 |
0.0186 |
0.000 |
0.000 |
0.000 |
0.000 |
0.021 |
0.021 |
0.065 |
|
Mar |
|
|
|
|
|
|
|
|
|
|
|
|
|
|
Apr |
|
|
|
|
|
|
|
|
|
|
|
|
|
|
May |
|
|
|
|
|
|
|
|
|
|
|
|
|
|
Jun |
|
|
|
|
|
|
|
|
|
|
|
|
|
|
Sub-total |
0.000 |
0.000 |
4.7304 |
4.7304 |
0.0186 |
0.0186 |
0.000 |
0.000 |
0.000 |
0.000 |
0.021 |
0.021 |
0.137 |
|
Jul |
|
|
|
|
|
|
|
|
|
|
|
|
|
|
Aug |
|
|
|
|
|
|
|
|
|
|
|
|
|
|
Sep |
|
|
|
|
|
|
|
|
|
|
|
|
|
|
Oct |
|
|
|
|
|
|
|
|
|
|
|
|
|
|
Nov |
|
|
|
|
|
|
|
|
|
|
|
|
|
|
Dec |
|
|
|
|
|
|
|
|
|
|
|
|
|
|
Total |
0.000 |
0.000 |
4.7304 |
4.7304 |
0.0186 |
0.0186 |
0.000 |
0.000 |
0.000 |
0.000 |
0.021 |
0.021 |
0.137 |
Architectural Services Department First Issue Date -20 : 07 : 2009
Standard Form No. D/OI.03/09.002 Current Issue Date -21 : 09 : 2011
Page 2
|
Architectural Services Department |
Form No. D/OI.03/09.002 |
|
Description of mode and details of recycling if any for the month e.g. XX kg of used timber was sent to YY site for transformation into fertilizers |
|
21kg of glass bottles were sent to Action Health for recycling |
0.4kg of cans and 18.6kg of papers were sent to Wong Kei for recycling |
0 |
0 |
0 |
0 |
|
Notes: |
(1) |
The performance targets are given in the Particular Specification on Environmental Management Plan. |
|
(2) |
The waste flow table shall also include construction waste that are specified in the Contract to be imported for use at the site. |
|
(3) |
Plastics refer to plastic bottles/containers, plastic sheets/foam from packaging material. |
|
(4) |
Broken concrete for recycling into aggregates. |
|
(5) |
If necessary, use the conversion factor: 1 full load of dumping truck being equivalent to 6.5 m3 by volume. |
Architectural Services Department First Issue Date -20 : 07 : 2009
Standard Form No. D/OI.03/09.002 Current Issue Date -21 : 09 : 2011
Page 3
